
We get it. Incident data is difficult to read. Raw data tends to not be standardized, categorized, or filtered – making it nearly impossible to create summary analytics without spending hours manually organizing the information.
Not only is it hard to pick out trends or patterns, but people often don’t know what questions they’re supposed to ask or what insights they need to get – causing them to lose out on productivity and operational improvements.
A tool like Shoreline Incident Insights enables cloud ops teams to quickly and easily analyze incident data to effectively improve reliability, increase customer satisfaction, and optimize the on-call experience.
In this blog, we dive into three different and effective ways to categorize and filter your data with our Incident Insights tool to gain actionable insights.
What is Incident Insights?
Incident Insights is an analytics application that leverages machine learning to process data from your ticketing platform to categorize and group recorded incidents through pattern matching.
This cleanly organized data is then available in pre-built reports that enable users to highlight top issues and calculate important metrics such as mean time to acknowledge (MTTA) and mean time to resolution (MTTR). This simplifies the process of identifying the underlying causes of incidents and evaluating team performance trends.
Analyzed incident data gives engineering leaders access to critical information needed to optimally manage their teams. Unfortunately, without a tool like Incident Insights, they are usually hindered by the hours needed to tediously pull and scrub incident data. With Incident Insights, imported data is organized by ML to provide clear, easy-to-understand insights in seconds.
Here are three examples of how to capture insights from incident ticketing data.
Isolate your top incidents to reduce toil
It’s essential to understand what incidents are occurring most frequently and what it takes to resolve those incidents.
Why? By analyzing data this way, you can determine where most of your team’s time is being spent and build a plan to eliminate or minimize time-consuming fixes. Your solution will vary depending on the type of incident, but either way, you are giving your team more time to focus on other priorities.
For example, if an incident happens a lot and takes a while to resolve, then it’s a sign that it’s a repair worth automating—or one in which you need to eliminate the root cause.
If an incident happens repeatedly and takes seconds to resolve, it’s a strong signal that your alarm probably has the wrong trigger point. The team is just clicking a button to resolve the issue, but not really making meaningful repairs. The alarm settings need to be adjusted to eliminate noise and distractions.
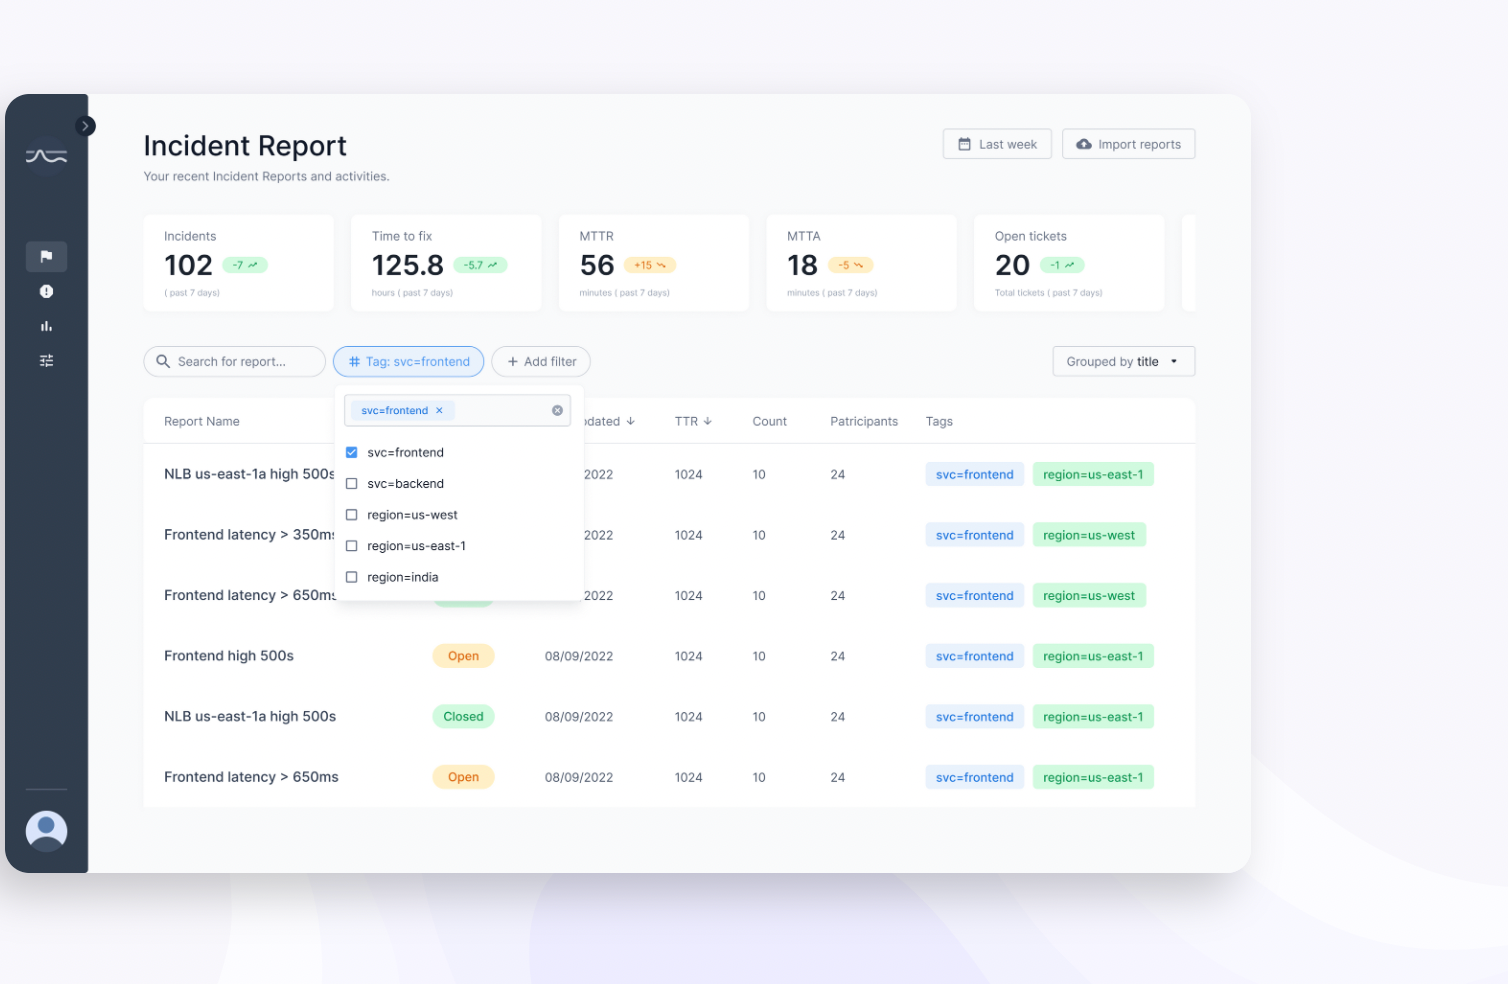
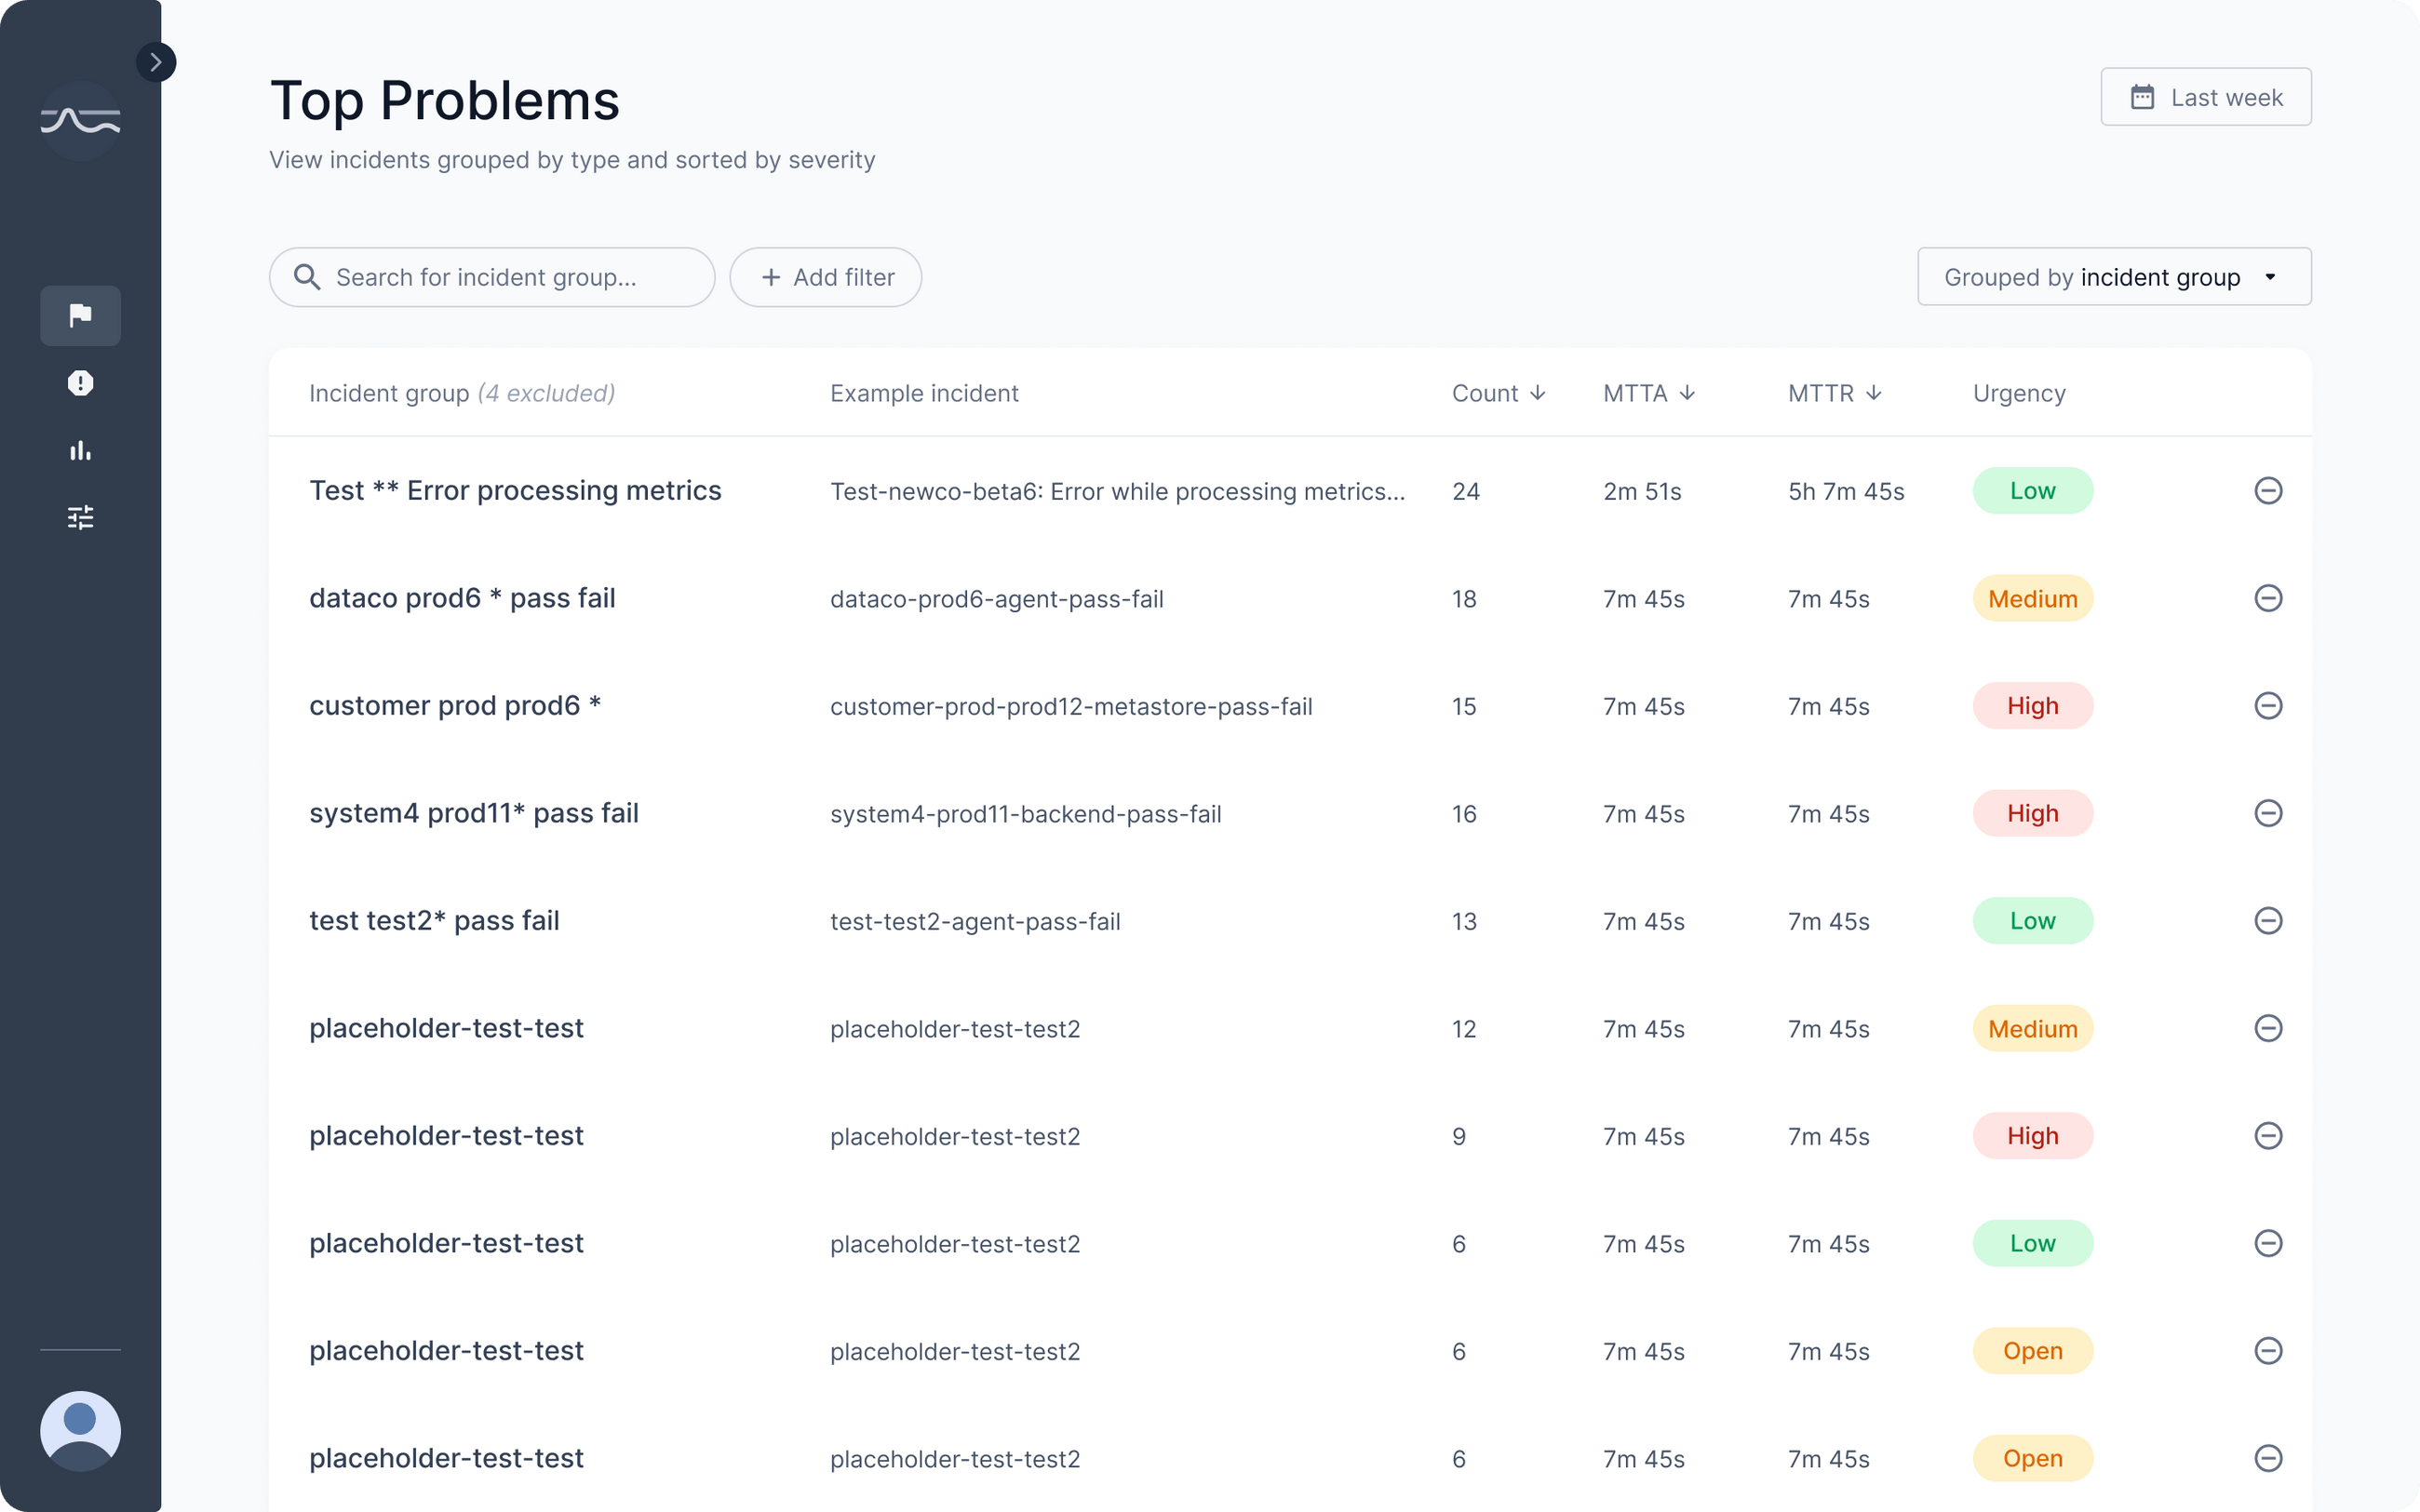
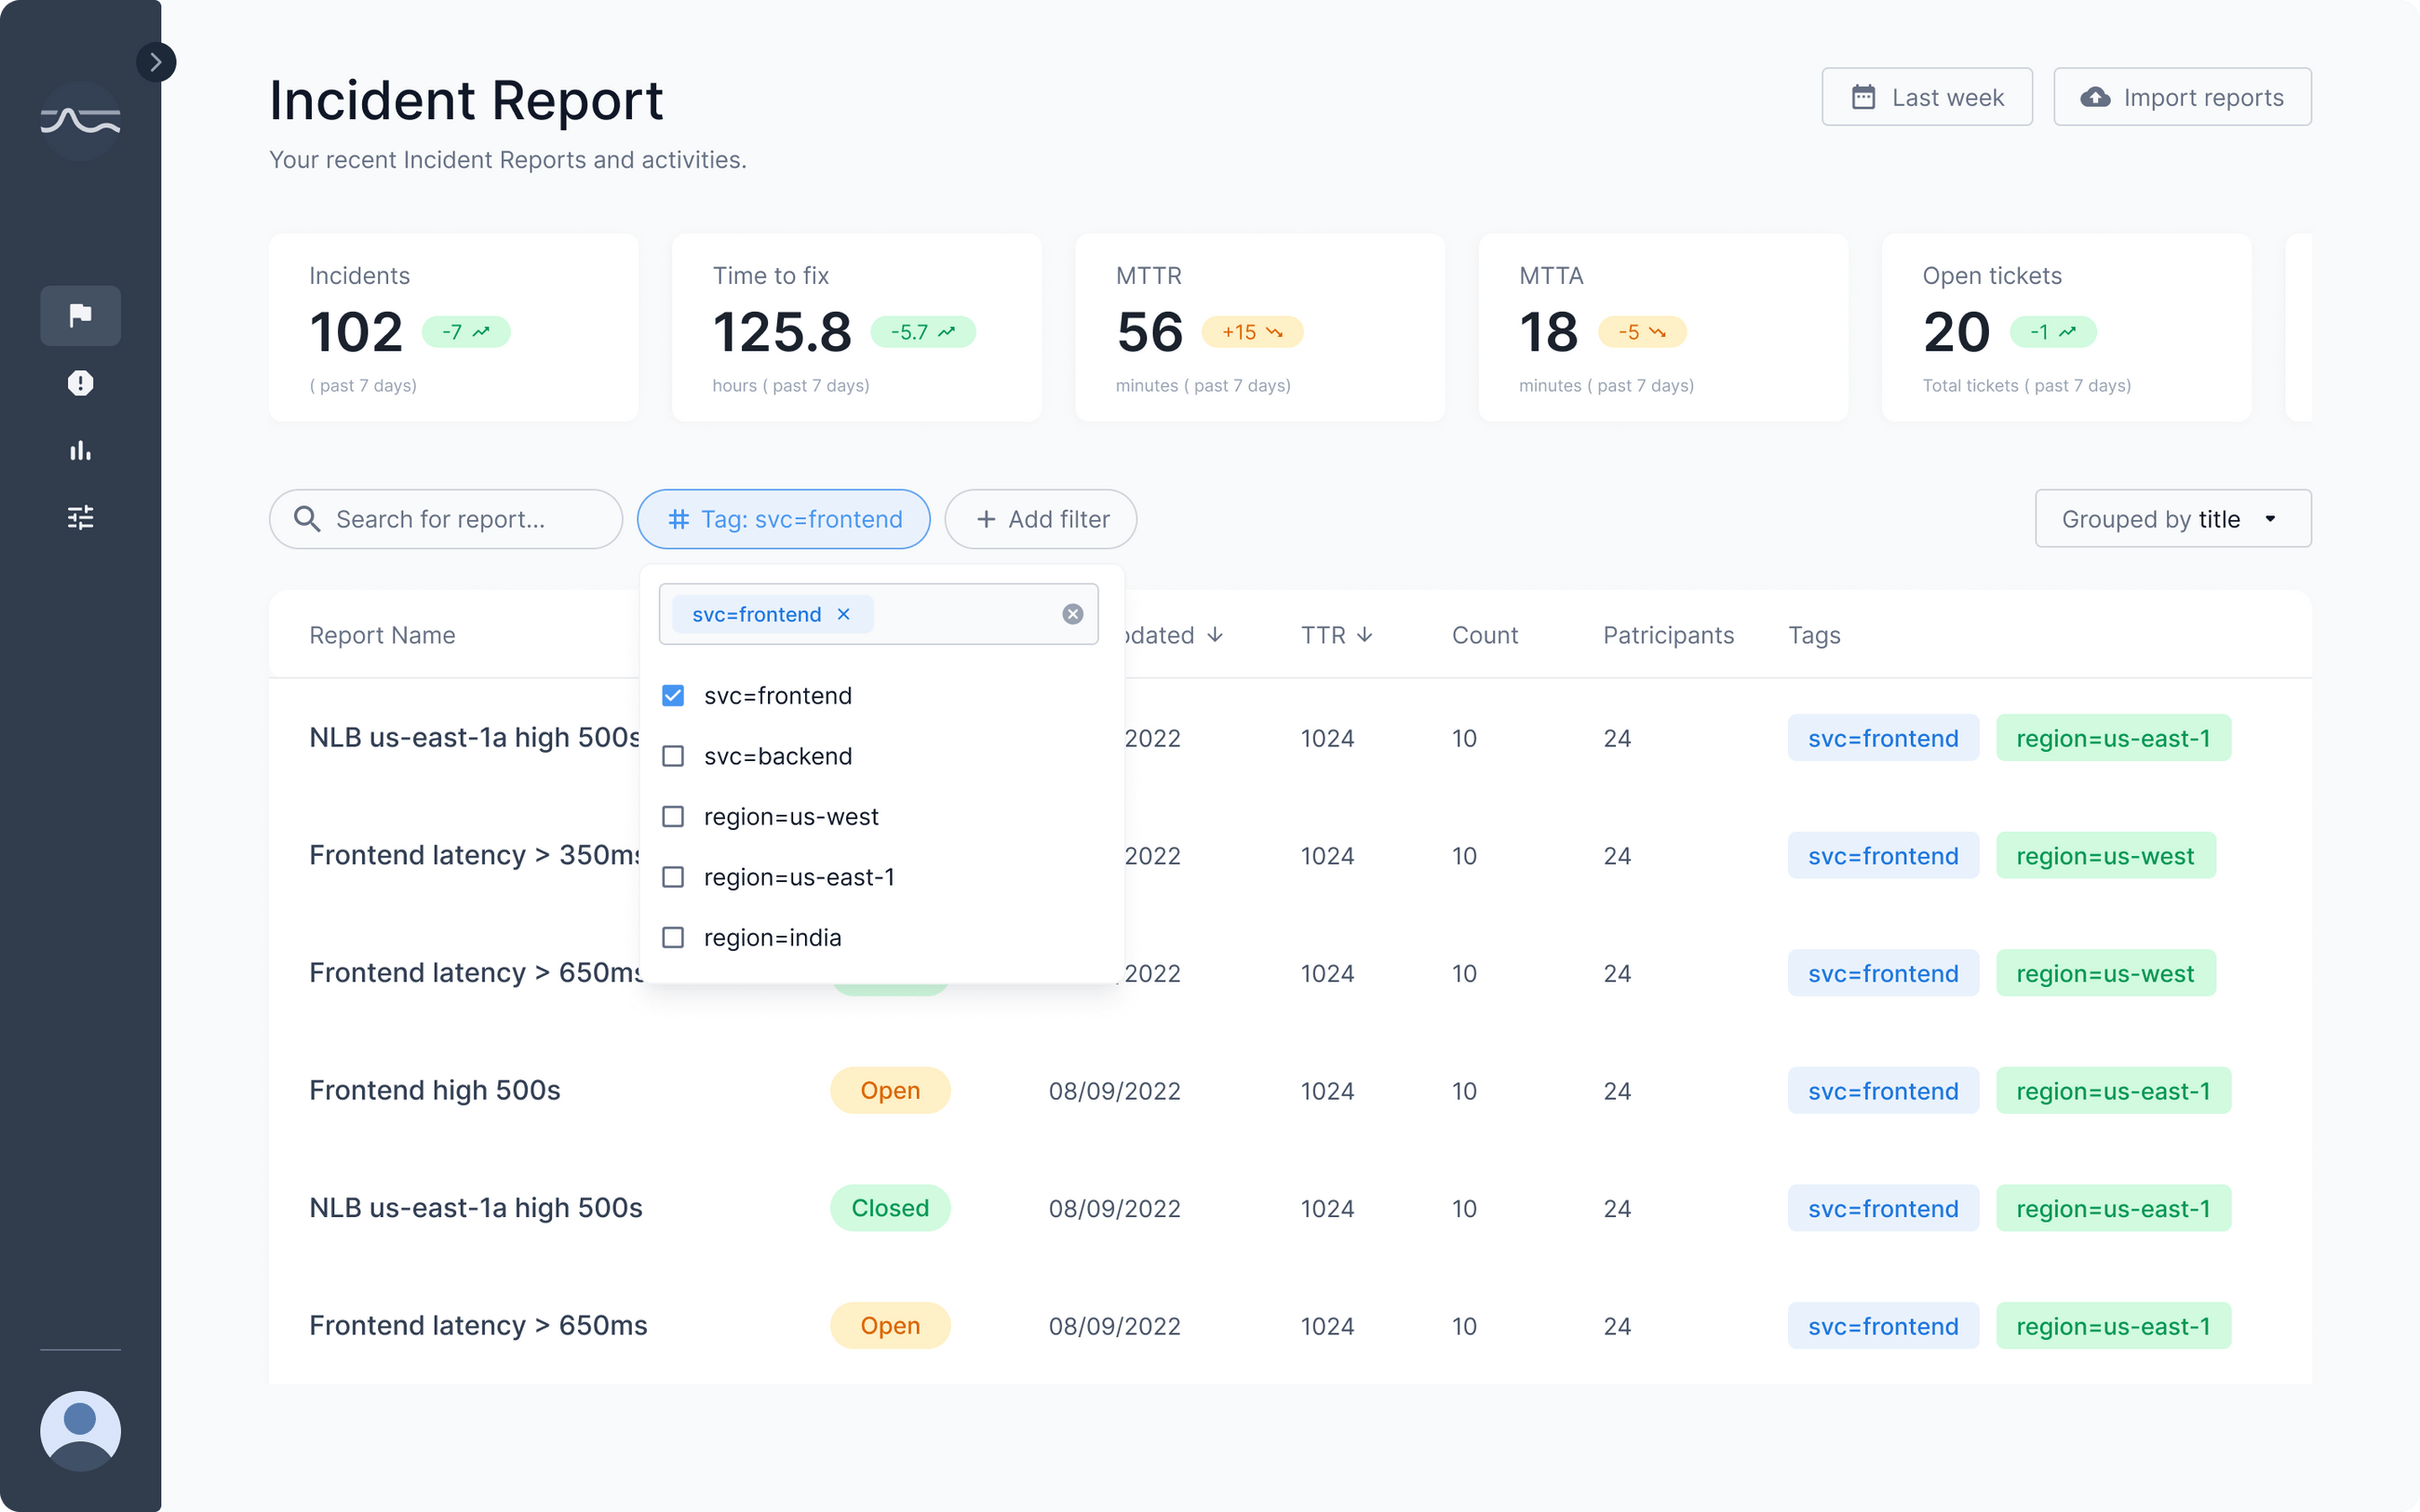
With Incident Insights, top incident categories are automatically identified from your ticketing data. Reports can be filtered by user, category, service, or search term. Your settings are always automatically saved — resulting in less noise from ticket data.
Clicking on the Top Problems tab brings you to a full incident report for any group you select over any time period you prefer. Drilling into a specific category provides detailed statistics such as incident count, MTTR, MTTA, number of open incidents, participants, and links back to the original source data. This is crucial when assessing the on-call actions taken or a root cause software fix to identify automation opportunities.
Contextualize your team’s health to better balance workloads
Incident data provides a wealth of information about the way your team operates.
With our Team Health dashboard, you can understand how on-call is affecting your teams and individual engineers. You can see which team members are carrying a heavier workload than their teammates and where there are individual performance gaps.
Why is this important? Understanding trends in team health can help you delegate work more effectively and proactively spot (and prevent) burnout. You can evaluate how the number of on-call participants is changing over time to see if too many (or not enough) people are spending time to help on-call initiatives (helping you plan and budget for future hiring needs).
Focus on the impact of your investments and initiatives
Leaders invest a lot of time in trying to improve customer satisfaction and productivity. But without data (particularly trends over time), it’s impossible to see if your efforts are paying off.
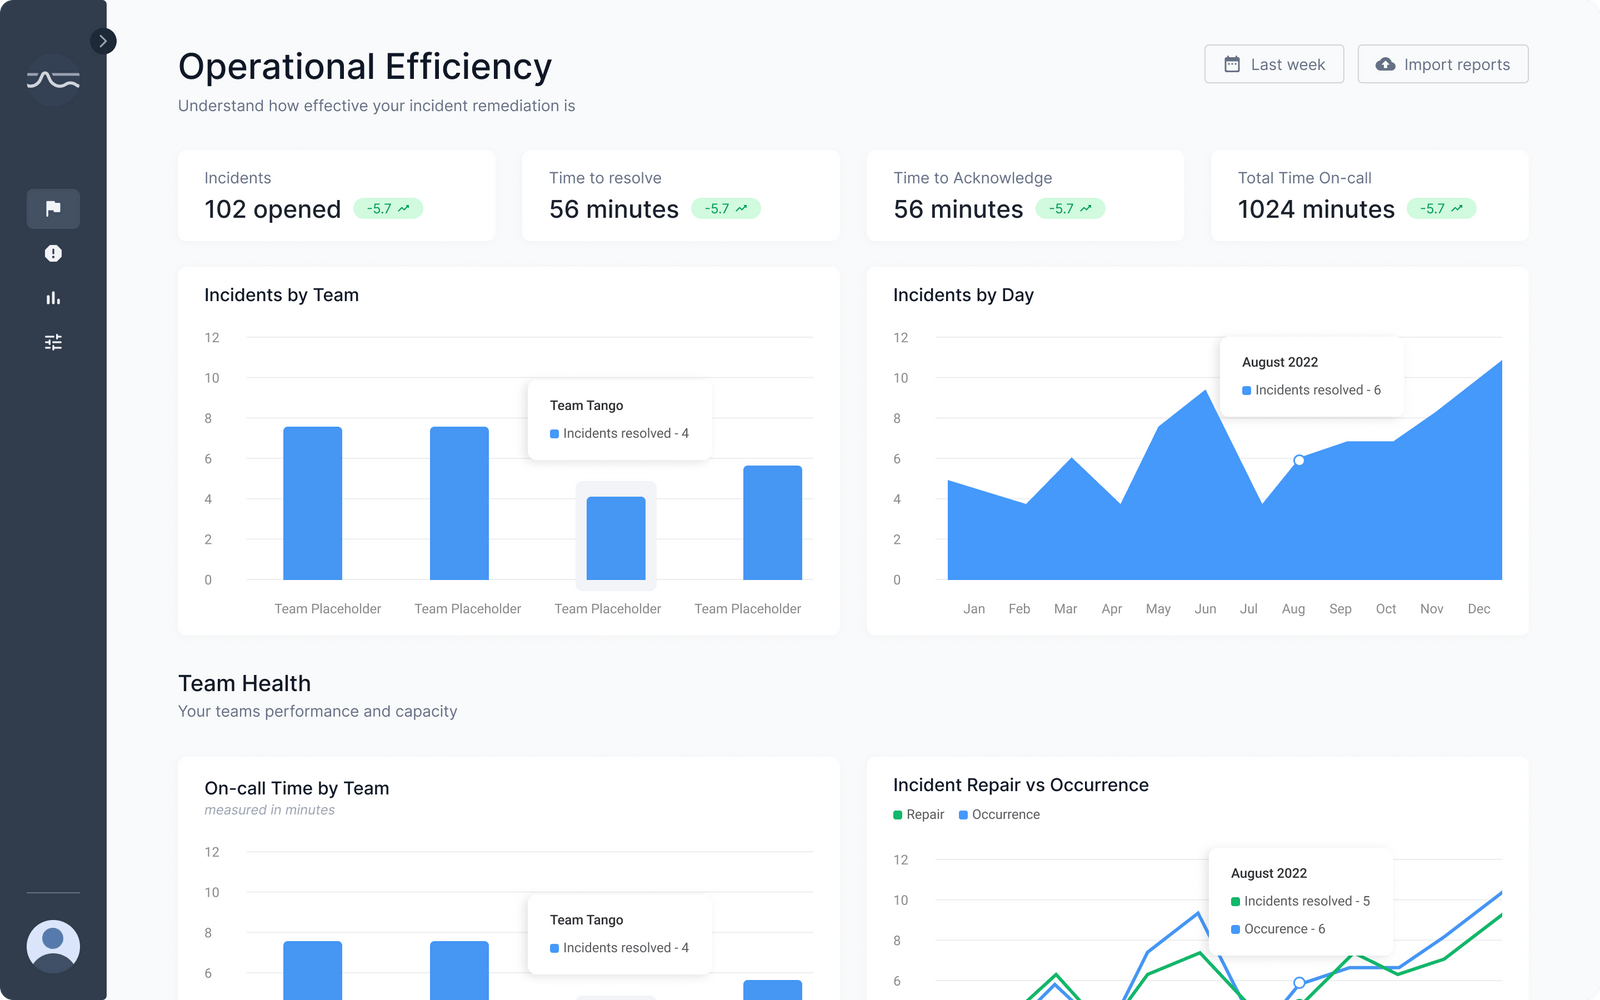
Analyzing incident data to track operational efficiency over time will help you see if key metrics are trending in the right direction and if new initiatives are having the right impact. This helps your team to work towards quarterly and annual goals for continuous improvement.
Within Incident Insights, an Operational Efficiency dashboard shows operational trends and performance metrics across your teams, services, and incidents. You can view historical incident counts by service, severity, escalation policy, MTTA and MTTR performance by service, or over time.
This helps you answer questions like:
- Is MTTR improving or deteriorating over time?
- Are we actually reducing toil?
- Are we eliminating some of the top causes of incidents?
Viewing summary-level data provides transparency into how your on-call team is performing with an incident count by time period, average MTTR, and tickets by service. This shows actual performance vs. SLAs/SLOs promised to customers.
Make messy data a thing of the past
Incident Insights provides immediate access to filtered data that will lead you toward better on-call operations. With this tool, you will:
- Discover new ways to reduce noisy alerts
- Improve customer experience
- Relieve overloaded teams
- Track incident trends
- See if on-call initiatives are making a difference
Shoreline Incident Insights comes with out-of-the-box integration for PagerDuty and Opsgenie, with integrations for ServiceNow, and ZenDesk ticketing systems coming soon.
Built by AWS experts, data security best practices are fully baked into the design, including end-to-end data encryption in transit and at rest. Incident Insights is a read-only tool, and will not disrupt production systems.
Try Incident Insights Today
Incident Insights is available now — and it’s free (no commitment). Within minutes, your team can connect its ticketing data to Incident Insights and start getting valuable information about the source of issues and your team’s response time. Check out this self-guided demo or simply sign up with your email or Google, connect your ticketing system, and see it in action on your own data.